Object Detection
Sliding Window Object Detector
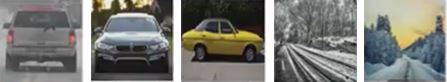
Assume we have a training set X which consists of two types of images: with cars and without.
Giving target label vector is: y = [1 1 1 0 0], where 1 indicates car object in the image.
Training process:
X -> ConvNet -> y_hat (Is there a car?)
is a classification problem.
In test time we can have a bigger image, so we slide across the image with a box (Sliding Window), take a crop, resize it to the size the ConvNet is expected and feed it to the ConvNet. Then we can change the size of the sliding window and repeat. A huge disadvantage of this method is computational cost. In order to get hight accuracy we need to slide across images with small stride (s = 1). Using bigger stride reduces the number of candidate crops but it increases possibility that the object will be partly missed (resulting Bounding Box will be shifted, not accurately placed around an object).
If FC layers are used then to classify all crops we need #crops forward passes. Not optimal because there are lots of overlapped computations.
There is a better way - turn each FC layer into Conv layer. It will allow to classify all crops in one forward pass.
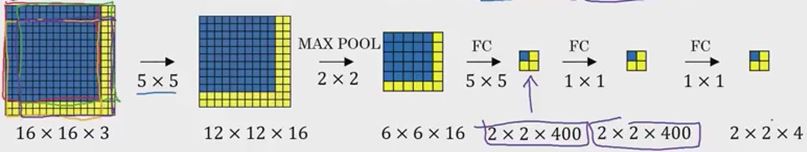
Example (with 4 classes):
X {14x14x3} -> Conv {5x5x3x16} -> {10x10x16} -> MaxPool {2x2} -> {5x5x16} -> FC {400} -> FC {400} -> Softmax {4}

X {14x14x3} -> Conv {5x5x3x16} -> {10x10x16} -> MaxPool {2x2} -> {5x5x16} -> Conv {5x5x16x400} -> {1x1x400} -> Conv {1x1x400x400} -> {1x1x400} -> Conv {1x1x400x4}
OverFeat architecture uses convolutional implementation of sliding windows.
Assume that we use a sliding window of size 14x14 which is sliding with a stride = 2. To evaluate our detector we pass an image 16x16x3. Then in one forward pass we get predictions for all 4 crops:
For bigger image we get:
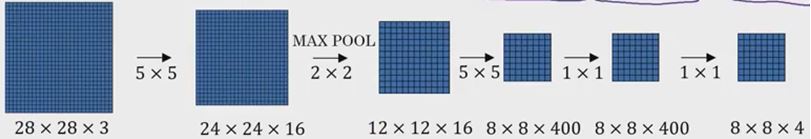
The output of the network is a 3-d array in which the 3rd dimmension represents class scores (box confidence) for a particular crop of the input image.
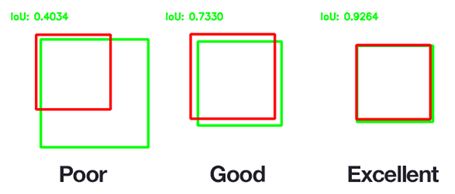
Intersection over Union (IoU)
Metric which is used to evaluate an object detection algorithm (map localization to accuracy). IoU is a measure of the overlap between two BBs.
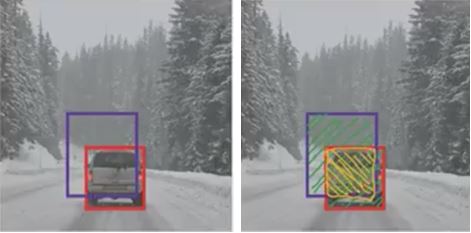
IoU(graund truth box, predicted box) = area of Union / area of Intersection
Set threshold value, usually 0.5 (or higher). So if IoU >= 0.5 then we consider the detection is “correct”.
Non-maximum Suppression
The algorithm is used to get rid of redundant BBs.
1) Discard boxes with pc < 0.6
For each box with pc > 0:
2) Pick a box with the highest pc
3) Discard (set pc = 0) remaining boxes for which the IoU >= 0.5 with one from the step 2.
YOLO inference (brief):
Take an image (448x448x3) and pass it through ConvNet (modified GoodLeNet + several additional layers + 2 FC layers).
The output is a tensor 7x7x30.
7x7 refer to 7x7 grid cells on input image and 30 contains info of 2 bounding boxes for a particular cell.
First five values of a 1x1x30 tensor is:
1) x-coordinate of BB center inside cell ([0; 1] wrt grid cell size);
2) y-coordinate of BB center inside cell ([0; 1] wrt grid cell size);
3) w - width of a BB ([0; 1] wrt image);
4) h - height of a BB ([0; 1] wrt image);
5) c - BB confidence ~ P(obj is in BB1) ([0; 1] wrt to image).
Second five values as the first five only for BB2.
The left twenty values are scores for twenty classes. These scores don’t bound to any particular BBs. To obtain class scores for a BB, we neet to multiply each class score with BB’s confidence. So for each cell we have two BB’s class scores. And total 98 BBs.
Then choose one class and take scores across all BBs, set score value = 0 for BB’s score < threshold (0.2). Sort BBs in descending order wrt score for chosen class. Then use Non-Max Suppression algorithm to set srores to 0 for redundunt BBs - pick a box with the highest confidence, compare it with others (for which score isn’t 0) by calculating IoU and if IoU > 0.5 then set 0 score for the box with which we compare the one with the highest confidence. After pairwise comparison pick next highest confidence box and compare with the others and so on. As a result there are only few boxes left. Repeat for all classes.
Select boxes to draw by class score value: take the first box, find the max score value across all classes and draw it (the box color will represent particular class). If all scores are zero for some boxes, these boxes just don’t get drawn.